Features
Universal components that allow you to design a data logging workflow to meet your exact operational needs.

Logs keep detailed records of asset conditions during facility rounds or when performing maintenance procedures. Scheduling tells operators when activities are due and alerts notify them of readings that fall outside of normal boundaries.
Logs Workflow
Completely define a data collection workflow suitable for your operations. Everything in PlantLog is designed to be extensible so that it can serve a variety of purposes.

Groups: Use Groups to define geographical or functional areas within the facility.
- Set Groups to Force Barcodes, which will require users to scan a physical tag on an asset in order to perform an Activity.
- Add optional Details for a Group such as its geographic location and responsible parties.
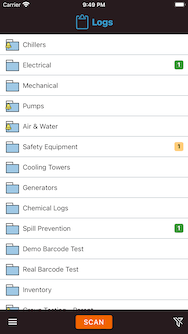
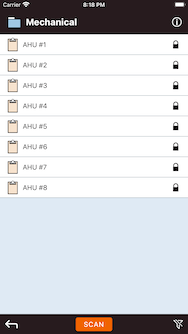
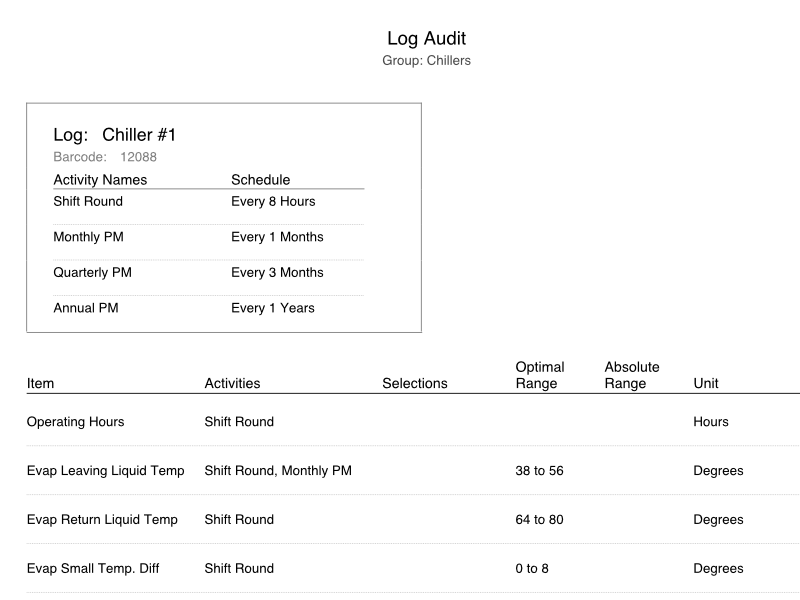
Logs: Define and organize Logs to represent each asset or area within the facility where data logging will be performed
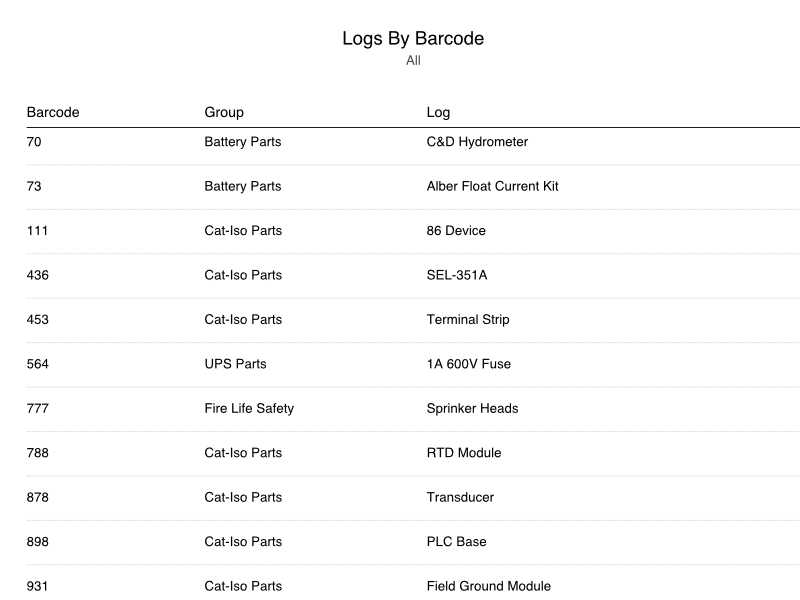
- Assign unique barcode values to Logs to associate with physical tags. Can also be used for SKU Numbers if the Log represents an inventory part.
- Add optional Details for a Log such as serial number and external support vendors.
Activities: Use Activities to define specific events and procedures performed on an asset
- Define up to 12 Activities for a given Log
- Optionally specify a recurring schedule for each Activity to define when the procedure needs to be performed based on specific dates or from when the procedure was last performed
- Add optional Details for an Activity such as tools required and safety precautions
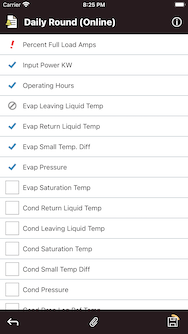
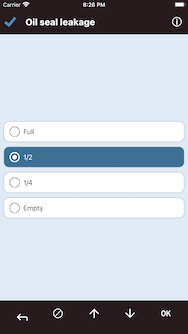
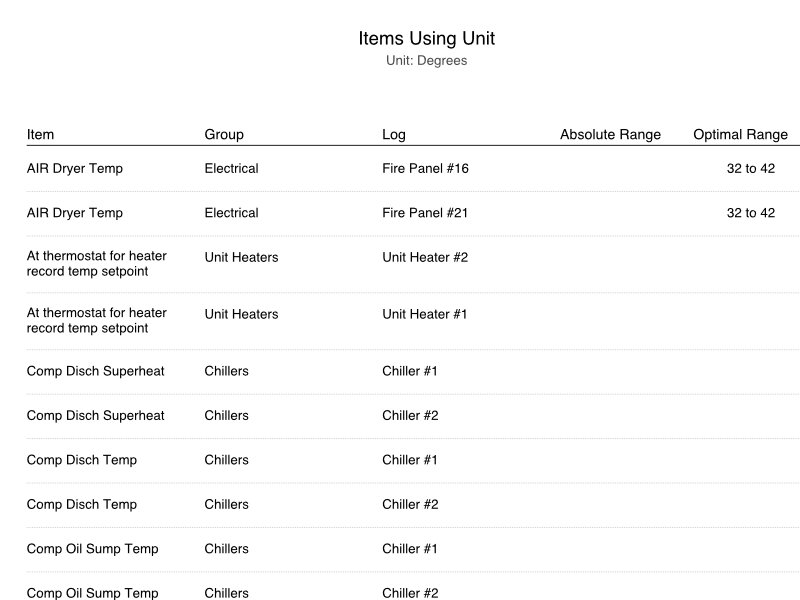
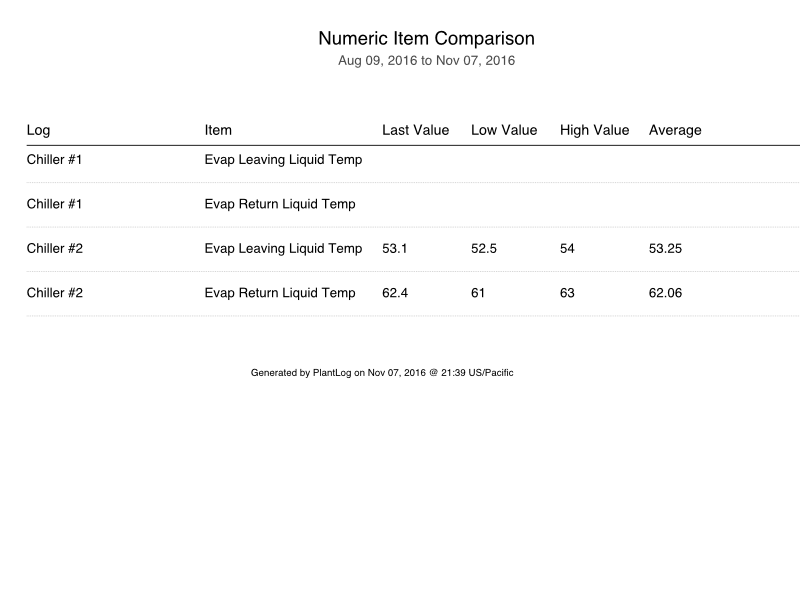
Items: Items are the specific metrics or tasks in which data will be collected on.

- Define and organize up to 999 Items for a given Activity to dictate the exact tasks or readings to be performed
- Assign Items to multiple Activities within a Log to eliminate redundancy and streamline trending
- Add optional Details for an Item such as instructions on how to perform a task or corrective actions to take under certain conditions
- Define unique list of Units that can be assigned to any Numeric Item
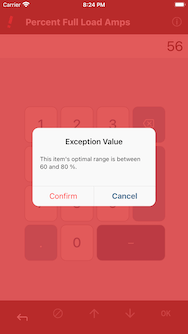
- Specify the absolute range permitted for any given Numeric Item to reduce human errors
- Specify the optimal range permitted for any given Numeric Item. Values outside of optimal range will be regarded as an Exception
- Define unique list of Selection Sets to be used with Selection Items
- Any Selection within a Selection Set can be designated as an Exception
- Specify Selection Sets as single choices or multiple choices when more than one condition can be valid at a given time
Adding Log Records
Most data collection will be done in the field using the PlantLog mobile app, which facilitates barcode scanning and offline data collection. However, Log records can also be added from the web application provided barcoding for its parent group is not mandatory.
- Support for offline mode where data can be reviewed and collected without the need for an active internet connection
- Scan barcode via rear facing camera to identify assets and to perform specified Activities
- Warning alerts when data entered has been designated as an Exception
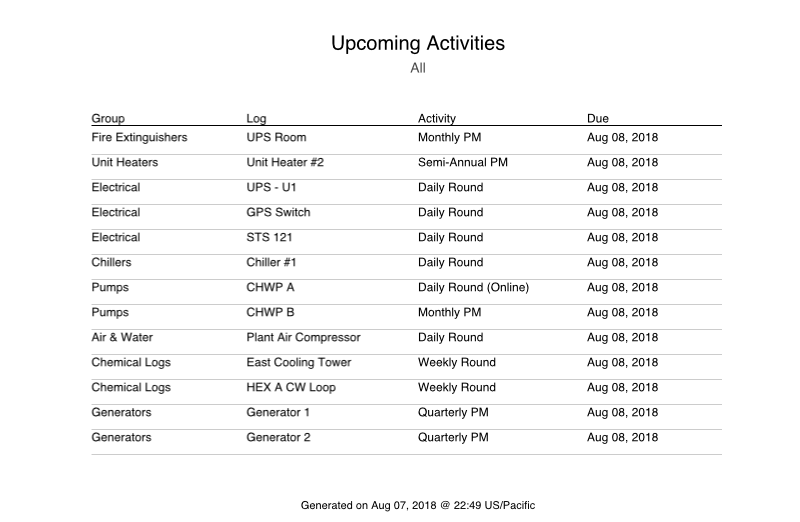
- Filter list of Logs to only ones that currently have a scheduled Activity that is due
- User notified by flashing light bulb when details for a given element can be viewed
- Filter list of Logs into groupings based on completion status with ‘All’, 'Done' and 'To Do' options
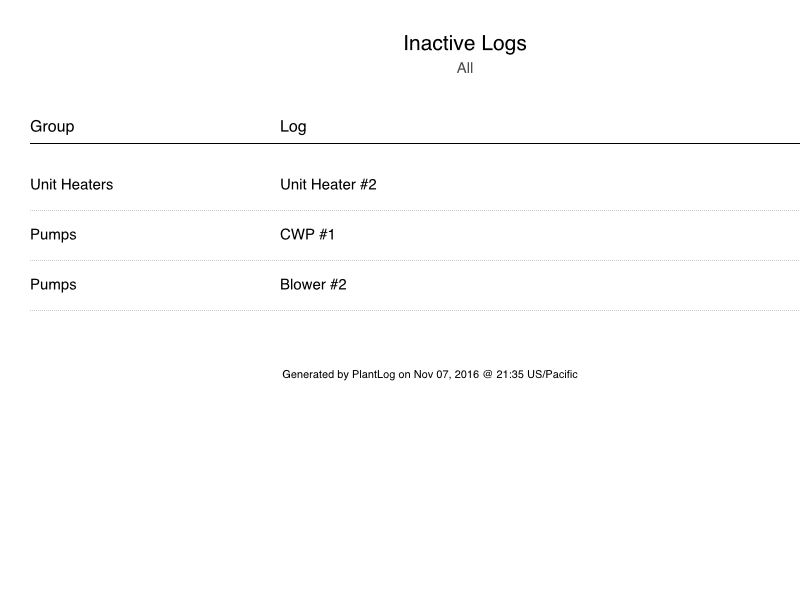
- Set entire Log to ‘Inactive’ when Activities cannot be performed, such as when an asset is down for maintenance
- Set individual Items to ‘inactive’ when a task or reading cannot be performed such as when a gauge is damaged
- All data input is associated to the user currently signed in
- Automatic time tracking to measure the duration to complete each Activity within a Log
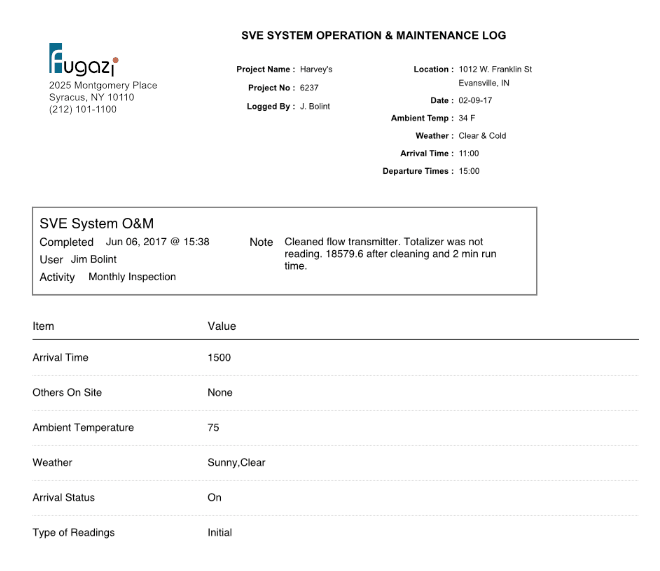
- Input optional notes to document any unusual conditions while performing an Activity
- LED flash for scanning
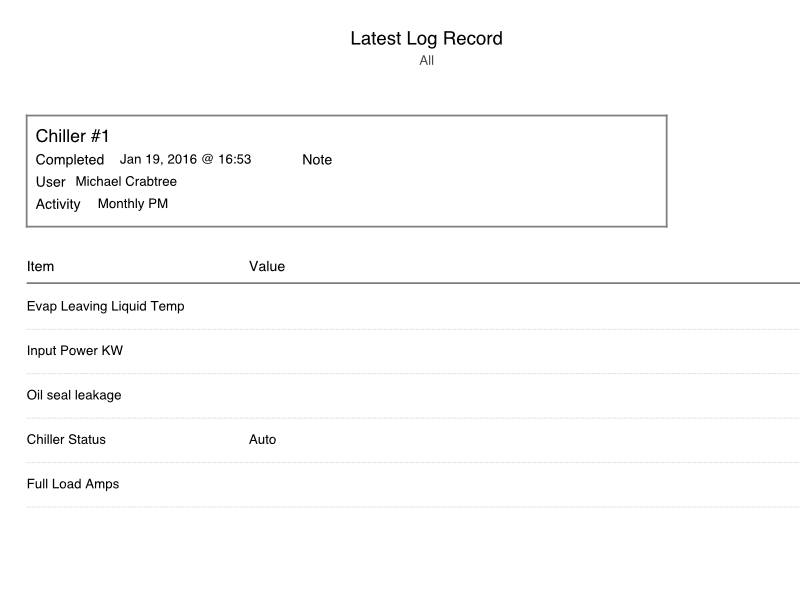
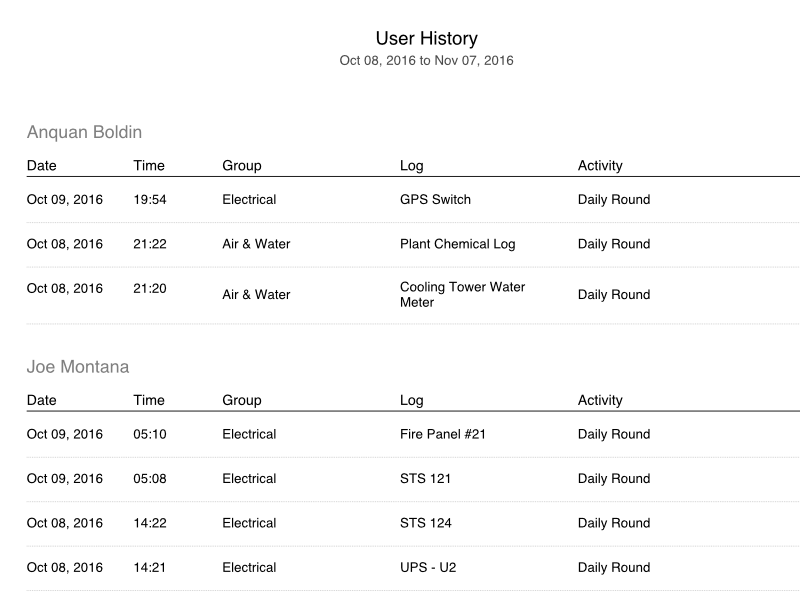
Viewing Log Records
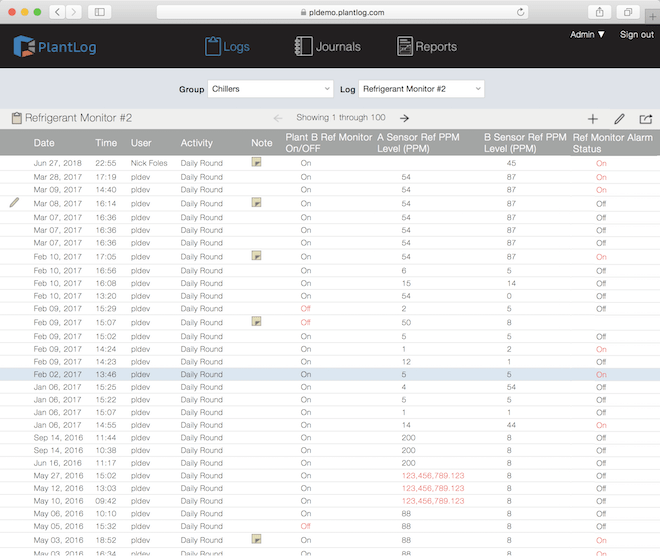
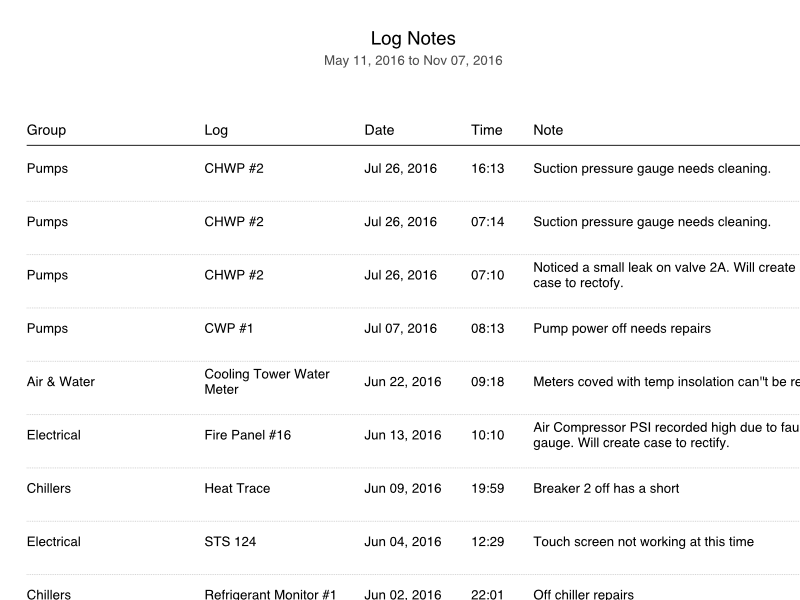
Complete history of asset conditions can be viewed through the Logs page of the web application.
- View any Logs history by selecting its parent group and then the appropriate log.
- All Log records are shown in chronological order according to their completion date and time.
- Note icon shown to indicate an option note was entered. Hovering the icon will display the full note text.
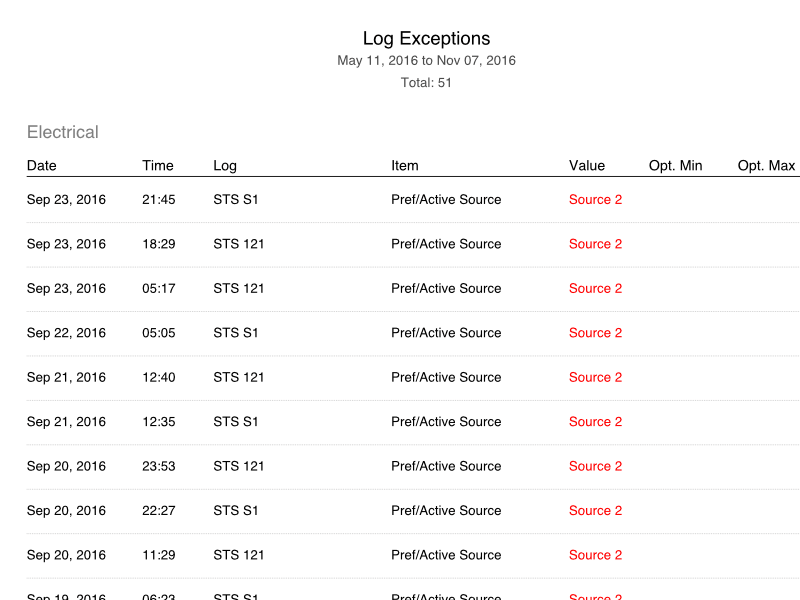
- All data that has been deemed an exception will be shown in red.
Editing Data & Audit Trails
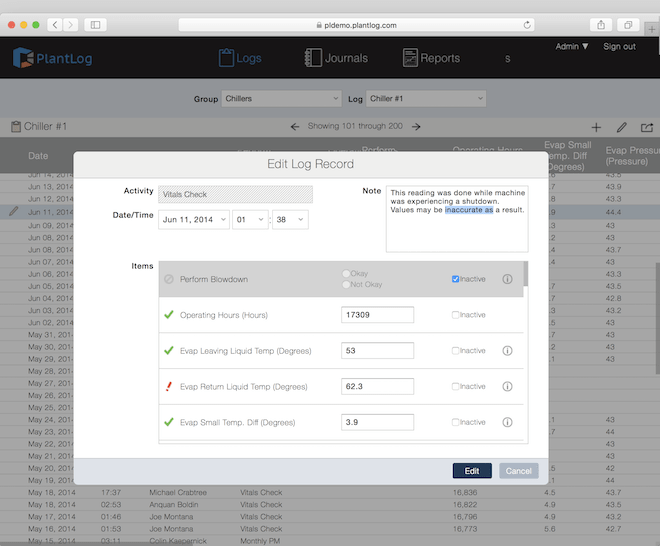
Log records can be edited after initial creation to correct human errors or augment details.
- Users can edit all aspects of a Log record including item values, notes and completed date and time.
- Edit tracking to provide a audit trail on what data was modified, by whom and reasons for making the edit.
- All records that have been edited will show yellow pencil icon on left edge.
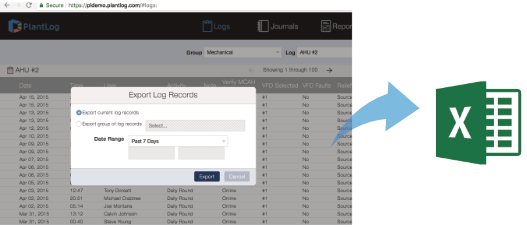
Exporting Log Records
Export Log records within specified date range to Microsoft Excel or export entire Group of Log records into a single file.

Journals replace traditional logbooks used to document events and conditions within the facility. Each journal created can be named to represent their content and purpose such as Shift Turnovers, Supervisor Reviews and Visitor Logbook. They provides a means to quickly review recent events in chronological order and identify their criticality.
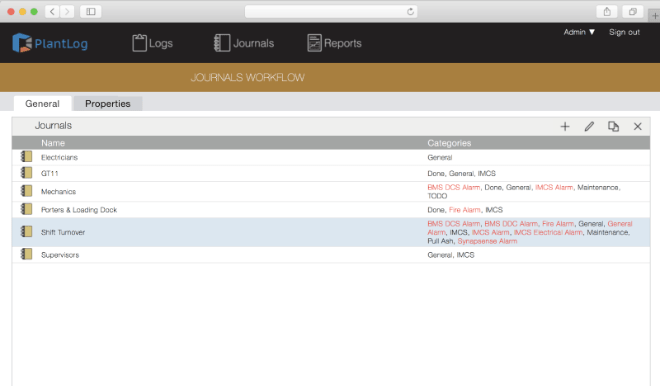
Journals Workflow
Administrators have full control over how to configure Journals in which records will be created for.
- Create separate journals for functional areas or purpose.
- Create unique lists of categories to be assigned to one or several journals.
- Each category can also be designated as an Exception to indicate that it is critical in nature.
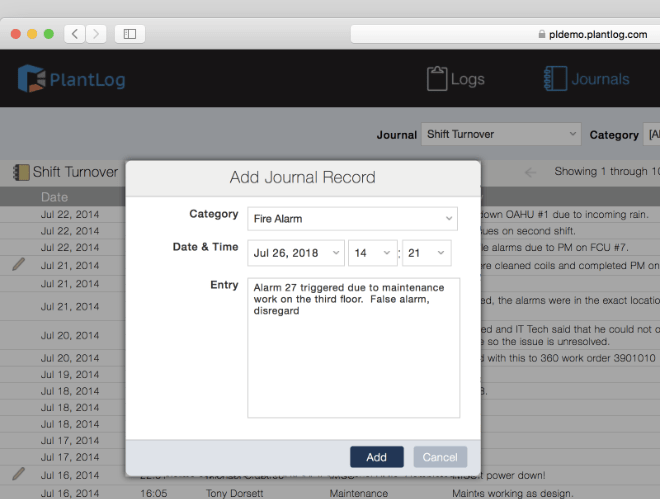
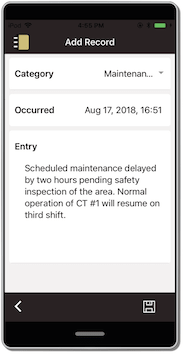
Adding Journal Records
Journal records can be added from the field using the mobile app as well as the web application when the user is stationary.
- User selects one of the categories associated with the journal prior to making an entry.
- Notification shown when user selects category that has been designated as an exception.
- User can adjust date and time for the record to reflect when the event took place.
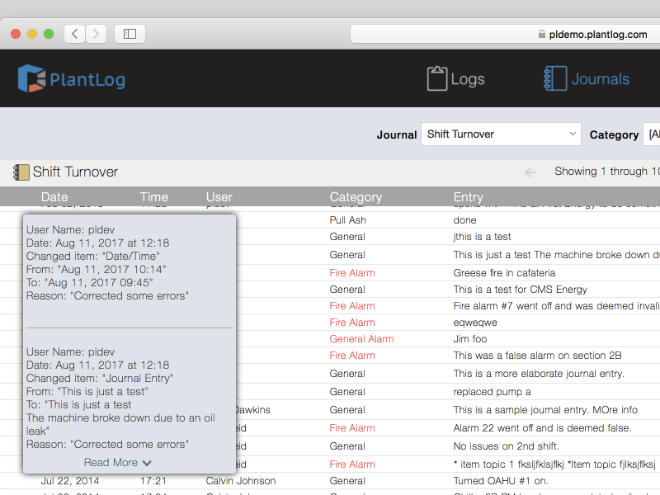
Editing Data & Audit Trails
- Users can edit all aspects of a journal record to correct human errors or augment information.
- Edit tracking to provide a paper trail on what data was modified by whom and reasons for making the edit.
- Hover over Edit (pencil) icon to view what changes were made to a record and the data prior to the edit.
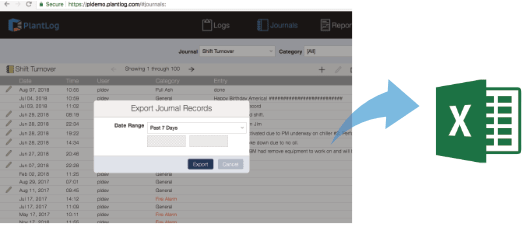
Exporting Journal Records
All Journal records created within a specified time period can be exported to Microsoft Excel.

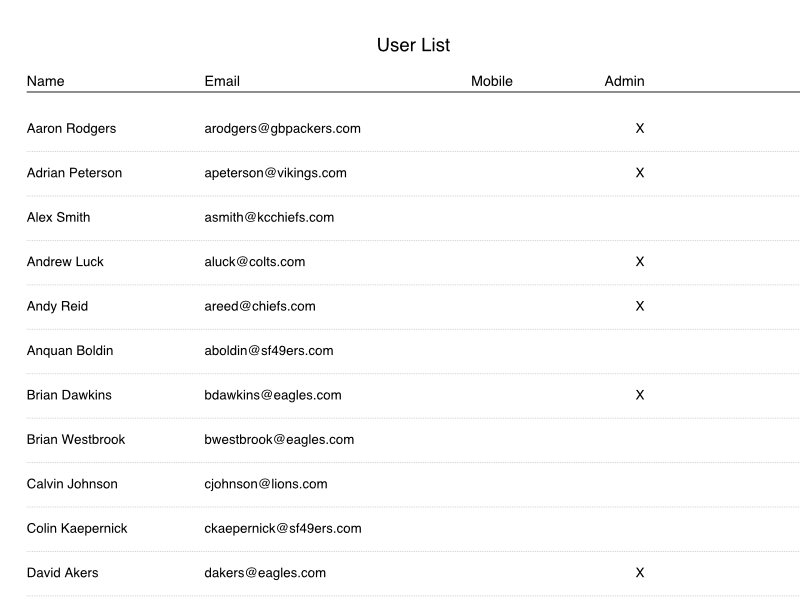
Labels enable you to categorize your facility data in different ways, for example, by asset class, manufacturer, or criticality — you can quickly filter and sort data based on the labels you've assigned to it. Each label consists of a name and an optional value, both of which you define.
Managing Labels
- Administrators create a master list of labels that can then be assigned to the various PlantLog objects.
- Colors to associate related groups of labels together.
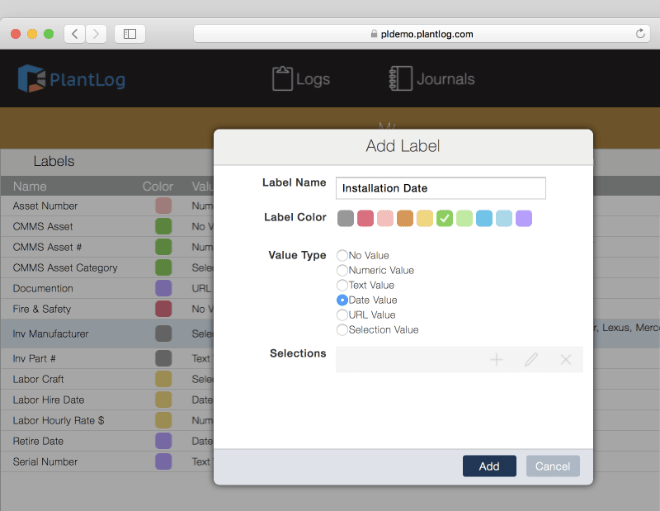
- Designate a value type for each label to ensure proper data is associated with it at the time of assignment.
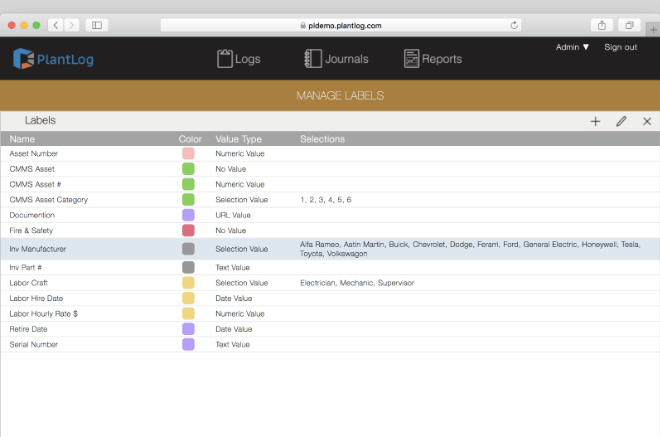
Label Value Types
- None: When the name of the label is sufficient such as Fire & Safety to be assigned to all fire extinguishers.
- Numeric: Such as Fuel Capacity to be assigned to all generators to indicate total gallons their tanks hold.
- Text: Alphanumeric values such as Model Number that is assigned to all physical assets.
- Date: Such as Decommission Date to be used to track when assets need to be retired.
- Selection: List of selections that can be chosen as the value such as Manufacturer containing all the asset manufacturers in the facility.
- URL: For an internet based address to either a web page or PDF document that a user will be navigated to when clicked.
Assigning Labels
- Administrators assign all relevant labels to the PlantLog objects.
- Each label assigned to an object is then provided with an accompanying value if applicable.
- Label values are unique to the objects they are assigned to.

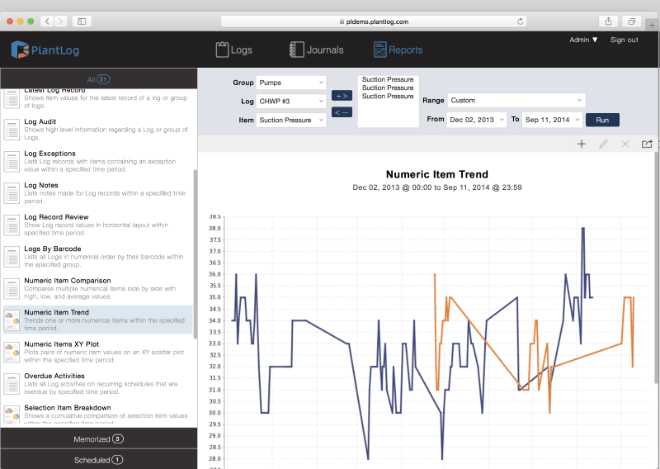
Reports allow you to slice and dice data for performance trending or predictive maintenance opportunities. A full suite of reporting capabilities will give you the insight to stay on top of all your facility maintenance tasks.
Overview
A full suite of tabular and graphical reports allows data analysis for virtually any facility type or needs. Each report can be customized and memorized for later use or automatically emailed to designated recipients. Custom report development also available to meet exact internal or regulatory requirements.
Report Generation
- Each report provides applicable settings to control where data is pulled from, how old the data is and other related criteria.
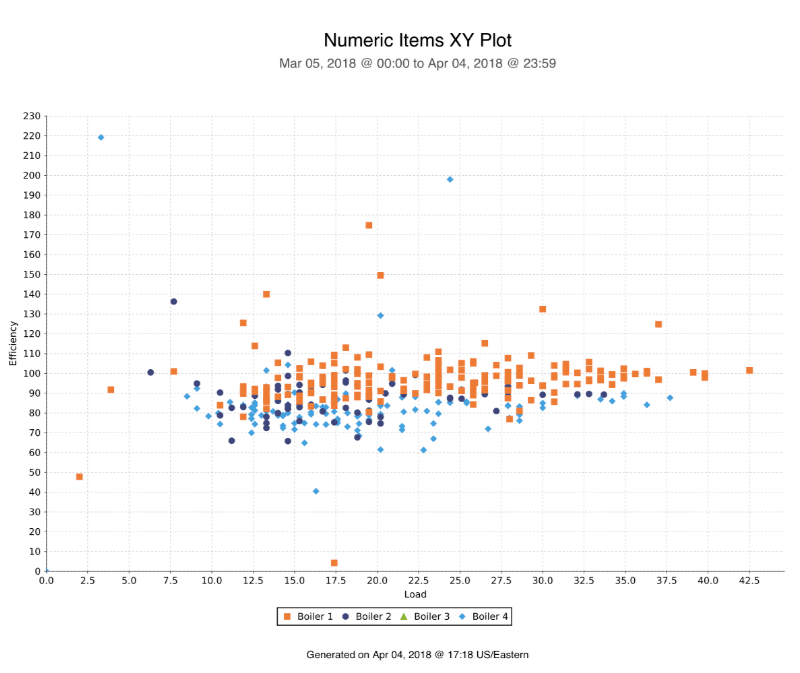
- All data that has been identified as exceptional or critical in nature appears in red color to be differentiated from normal data values.
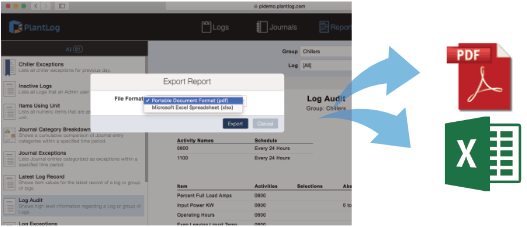
- Easily export reports to PDF or Excel for sharing and further analysis.
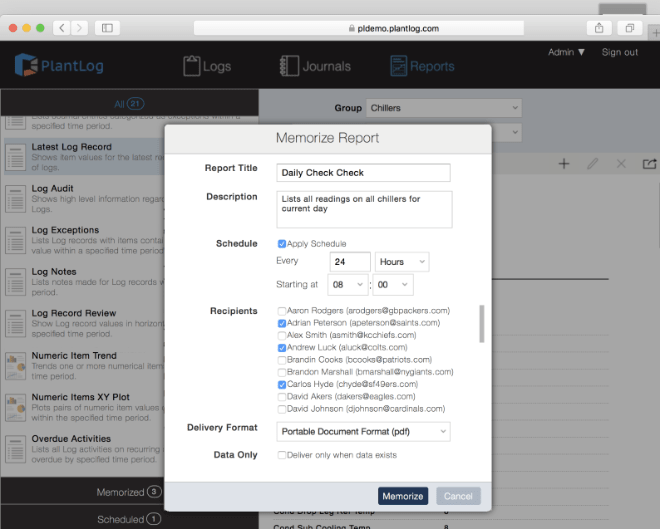
Memorizing & Scheduling Reports
- Each report can be memorized with a new name along with the settings associated it for quick referencing in the future.
- Schedules can also be applied to memorized reports so that they are automatically generated at set intervals and emailed to designated recipients.
- Report emails can be delivered as either PDF or Excel file attachments.
Standard Reports
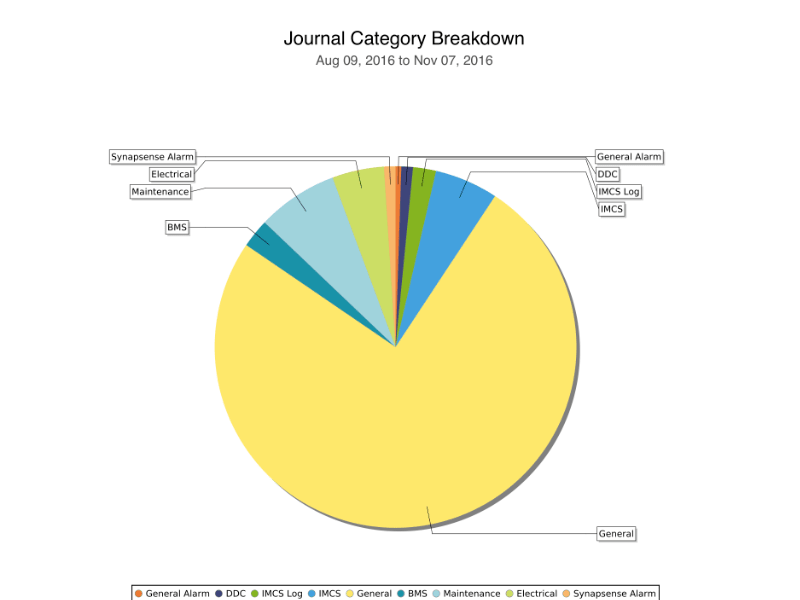
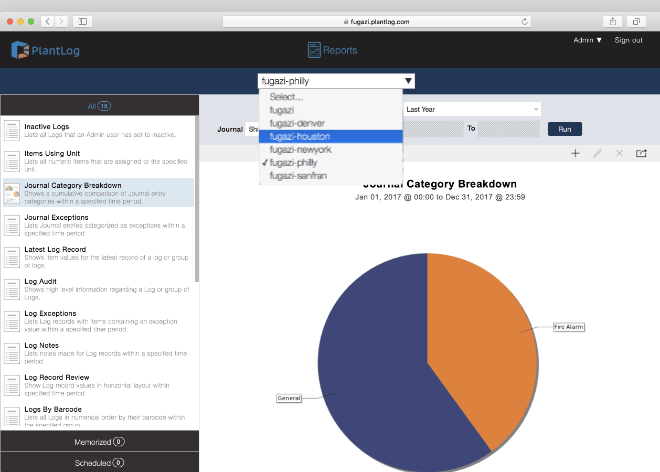
Journal Category Breakdown
Shows a cumulative comparison of Journal entry categories within a specified time period.
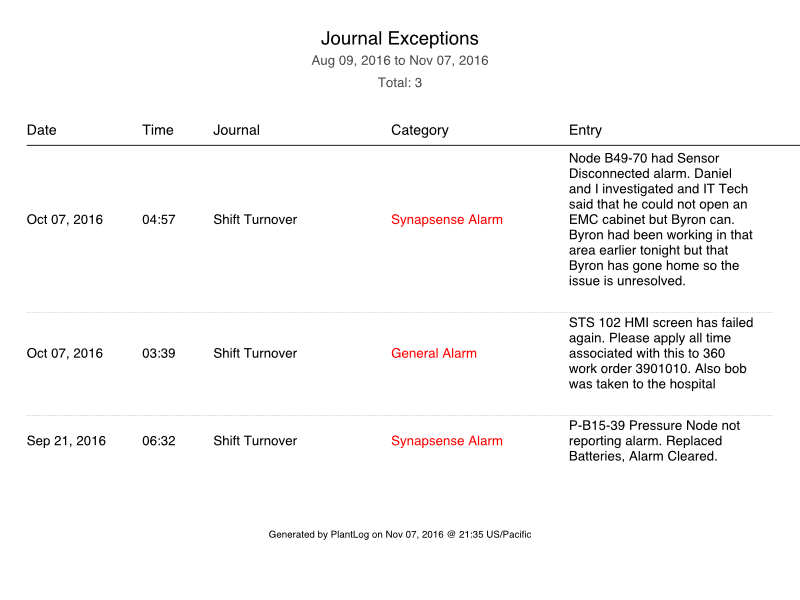
Journal Record Exceptions
Lists Journal records categorized as exceptions within a specified time period.
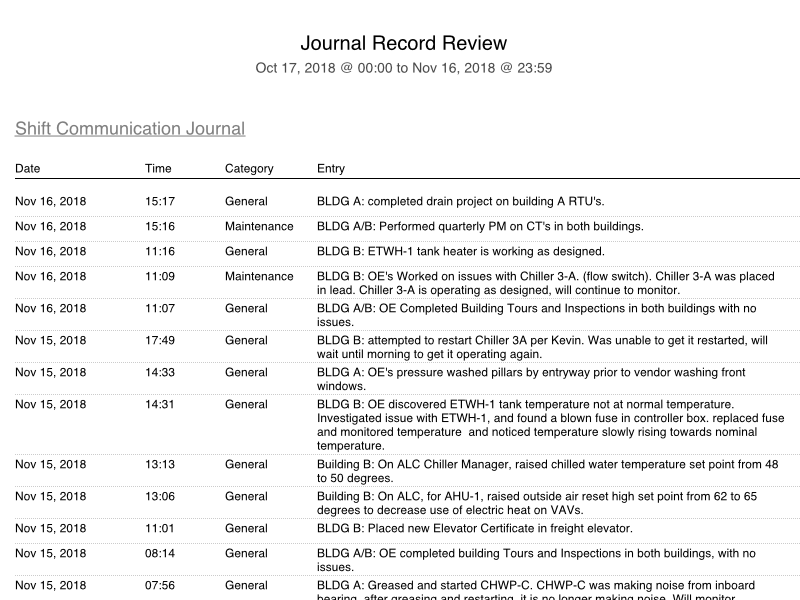
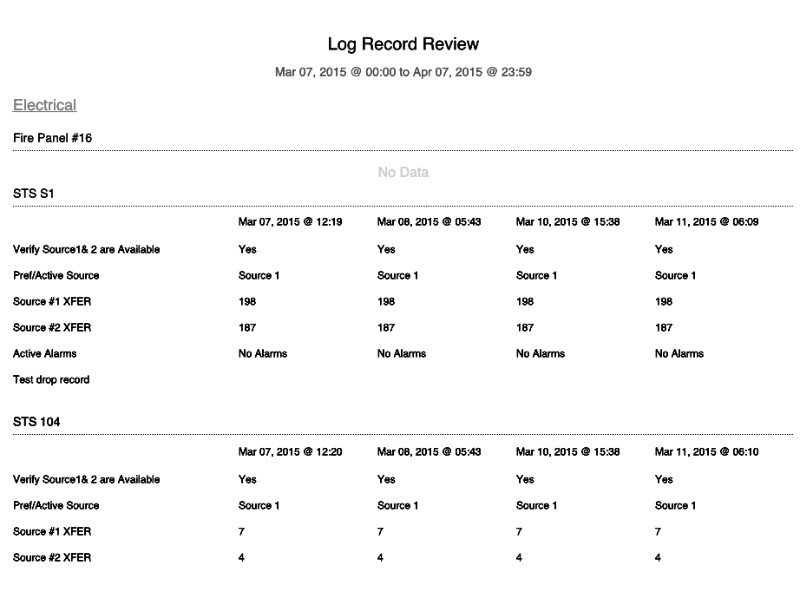
Journal Record Review
Shows complete records for a single Journal or all Journals within specified time period.
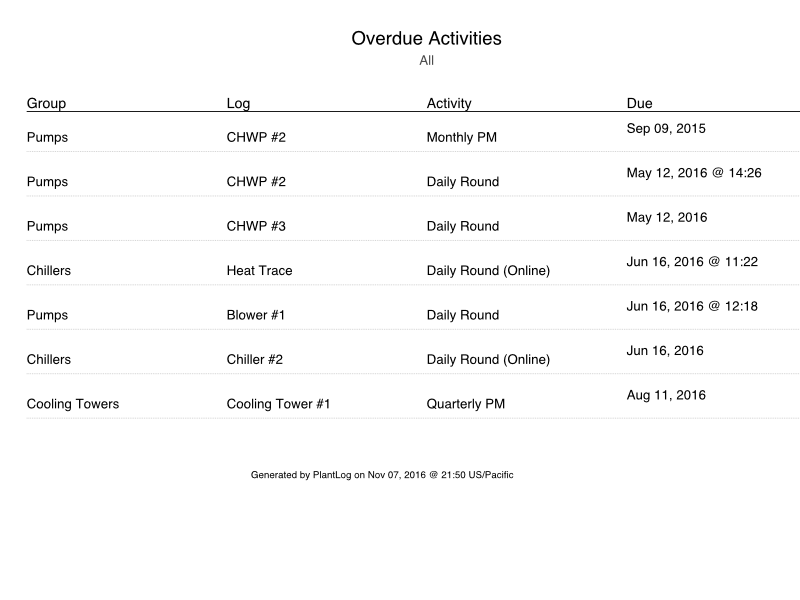
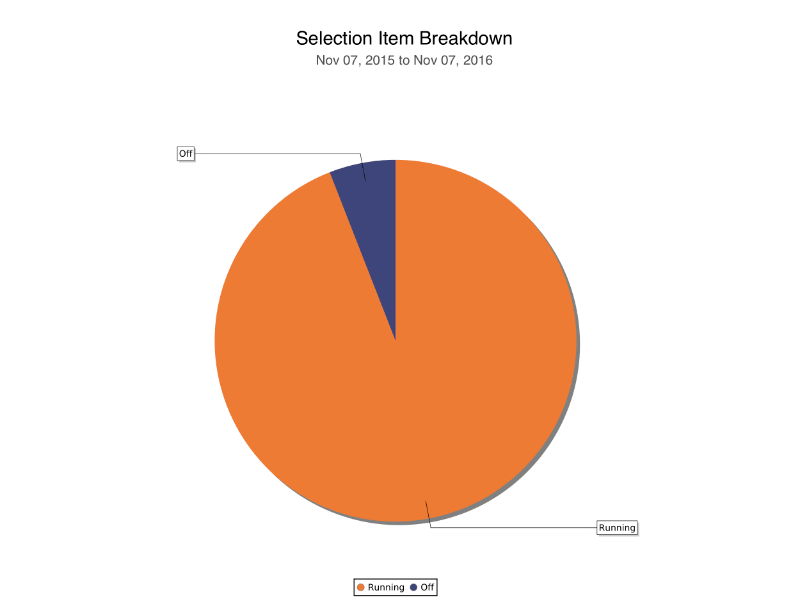
Log Record Exceptions
Lists Log records with items containing an exception value within a specified time period.
Custom Developed Reports
In addition to the standard suite of reports, custom reports can be developed and deployed to each customer to meet their exact functional and visual specifications.
- Each custom report includes all applicable settings to ensure flexibility.
- Cost is based on a per report basis, accounting for complexity and design parameters.
- Custom developed reports are available to all site accounts within the organization at no additional cost.
Organization Wide Reporting
All customers who use PlantLog across multiple sites can access a free top level organizational account, which allows upper management to generate reports across the organization in a single location.
- View reports with data from any site within the organization.
- Custom reports to pull data from multiple or all sites within the organization.
- Independently memorize and schedule reports separately from the individual site accounts.
Exporting Report Data
All reports can be exported to either Adobe PDF or Microsoft Excel depending on their type, which makes sharing data with external parties easy.